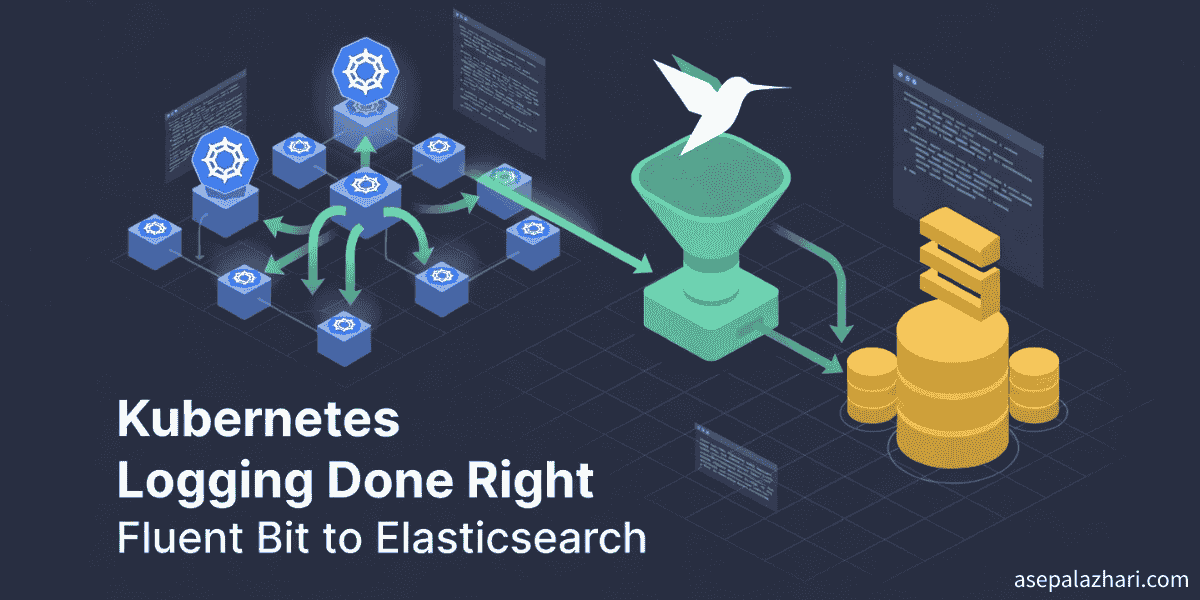
Kubernetes Logging Done Right: Fluent Bit to Elasticsearch
How I implemented centralized logging for Kubernetes with Fluent Bit and Elasticsearch, solving the ephemeral logs problem and enabling multi-namespace log collection.
The Day I Lost Critical Debugging Logs Forever
Picture this. Your production Next.js application crashes at 3 AM. Users are complaining. You rush to check the logs but the pod already restarted. All logs gone. Forever. This happened to me three times before I finally decided to fix it properly.
Running applications in Kubernetes brings amazing scalability and resilience. Your pods restart automatically when they fail. They scale up and down based on traffic. They get replaced during deployments. But here is the catch. Every time a pod dies, all its logs disappear with it.
For months, I relied on Axiom for application level logging. But that only captured what my Next.js code explicitly logged. System errors, startup messages, and crash dumps stayed in the ephemeral container logs. When pods restarted, those critical debugging clues vanished.
I needed a solution that would persist every single log from every pod in my my-app namespace, even when pods came and went. The answer was centralized logging with Fluent Bit shipping to Elasticsearch.
Why Centralized Logging Matters in Kubernetes
Kubernetes pods are designed to be ephemeral. They come and go. They scale. They restart. This design makes Kubernetes powerful but creates a logging nightmare.
When you run kubectl logs, you only see logs from running pods. If a pod crashed two hours ago, those logs are gone unless you have centralized logging in place.
Centralized logging solves this by collecting logs from all containers and shipping them to a persistent storage system. Now when a pod dies, its logs live on. You can search through historical logs, track errors across pod restarts, and debug issues that happened hours or days ago.
For the my-app captive portal serving thousands of WiFi users daily, losing logs meant losing visibility into user issues, security events, and performance problems. I needed every log preserved forever.
Choosing Fluent Bit Over Other Solutions
Several tools handle Kubernetes logging. Fluentd, Filebeat, Logstash, and Fluent Bit all work. I chose Fluent Bit for three compelling reasons.
First, resource efficiency. Fluent Bit uses around 100 to 200MB memory per node compared to Fluentd which can use 300MB or more. When you run it as a DaemonSet on every node in your cluster, those savings add up.
Second, simplicity. My use case was straightforward. Collect logs from specific namespaces and ship them to Elasticsearch. Fluent Bit handles this perfectly without the complexity of Fluentd plugins or Logstash pipelines.
Third, native Kubernetes integration. Fluent Bit automatically enriches logs with pod names, namespaces, labels, and annotations. This metadata makes searching and filtering logs much easier.
The official CNCF project status also gave me confidence. Fluent Bit is battle tested in thousands of production Kubernetes clusters worldwide.
The Architecture: How Fluent Bit Collects Logs
Understanding how Fluent Bit collects logs helped me debug issues later. Here is how it works.
Kubernetes writes all container logs to files on each node at /var/log/containers/. Each file follows a naming pattern. The pod name, namespace, container name, and container ID all appear in the filename.
For example, a log file looks like myapp-698fdf7c65-2lz2p_my-app_myapp-abc123.log. Notice how the namespace my-app sits right in the middle of the filename. This pattern becomes crucial later.
Fluent Bit runs as a DaemonSet, meaning one pod runs on every node. Each Fluent Bit pod watches the log directory on its node using the tail input plugin. When new log lines appear, Fluent Bit reads them.
The kubernetes filter then connects to the Kubernetes API server and enriches each log with metadata. It adds the pod name, namespace, labels, annotations, and more. This enrichment transforms a plain text log into structured data.
Finally, the Elasticsearch output plugin ships the enriched logs to your Elasticsearch cluster. Fluent Bit handles retries, buffering, and batching automatically. If Elasticsearch goes down temporarily, logs queue up and ship when connectivity returns.
Initial Implementation: Deploying Fluent Bit
I started by creating the necessary Kubernetes resources. First, a dedicated logging namespace to keep logging infrastructure separate from application workloads.
Next came RBAC permissions. Fluent Bit needs to read pod metadata from the Kubernetes API. I created a ServiceAccount, ClusterRole, and ClusterRoleBinding giving Fluent Bit read access to pods, namespaces, and logs.
The ConfigMap holds the Fluent Bit configuration. This is where you define inputs, filters, and outputs. My initial configuration read all container logs, enriched them with Kubernetes metadata, and shipped to Elasticsearch.
The DaemonSet deployment ensures Fluent Bit runs on all six nodes in my cluster. I set resource limits to prevent Fluent Bit from consuming too much CPU or memory. The configuration mounts three key paths. The /var/log/containers directory for reading logs. The /var/log/pods directory for additional metadata. And the /var/fluent-bit/state directory for tracking read positions.
Finally, I integrated the deployment into my GitLab CI/CD pipeline. Now every git push automatically updates the logging infrastructure along with my application.
Here is the core ConfigMap structure I started with:
[INPUT]
    Name tail
    Path /var/log/containers/*.log
    Tag kube.*

[FILTER]
    Name kubernetes
    Match kube.*
    Merge_Log On
    Keep_Log On

[OUTPUT]
    Name es
    Match kube.*
    Host 10.0.1.100
    Port 9200
    Index app_logs
    Logstash_Format On
This configuration collected all logs from all namespaces. Which brings me to the first major problem.
Problem One: Collecting Too Many Logs
Within hours, I noticed Elasticsearch filling up with logs from everywhere. System namespaces like kube-system, cattle-system, and logging generated massive amounts of logs. My application logs from the my-app namespace drowned in noise.
I needed to filter logs to collect only from the my-app namespace. This seemed simple. Add a grep filter to match the namespace field. Here is what I tried:
[FILTER]
    Name grep
    Match kube.*
    Regex kubernetes.namespace_name my-app
I applied the configuration, restarted Fluent Bit, and waited. Nothing changed. Logs from all namespaces kept flowing in. I spent hours debugging this before discovering the root cause.
The Grep Filter Mystery: Why Nested Fields Break Everything
The grep filter documentation said to use field names directly. But it failed silently. No errors. No warnings. It just did not work.
After examining Elasticsearch data, I discovered why. The kubernetes filter creates nested objects. The field structure looks like this:
{
    "kubernetes": {
        "namespace_name": "my-app",
        "pod_name": "myapp-abc123"
    }
}
The grep filter in Fluent Bit cannot access nested fields using dot notation. When I used kubernetes.namespace_name, grep could not find the field. So it allowed all logs through.
I tried moving the grep filter before the nest filter. I tried changing field names. I tried different regex patterns. Nothing worked consistently. The grep filter limitation with nested fields was a dead end.
If you are reading Why Docker Buildx Changed My CI/CD Game Forever, you know I hate wasting time on workarounds. I needed a better solution.
The Elegant Solution: Filter at the Source
Then it hit me. Why filter after reading logs when I could filter before reading them? Container log files already include the namespace in the filename.
Instead of reading /var/log/containers/.log and filtering later, I changed the input path to /var/log/containers/__my-app*.log. This pattern only matches files from the my-app namespace.
Here is the updated configuration:
[INPUT]
    Name tail
    Path /var/log/containers/*_my-app_*.log
    Tag myapp
    DB /var/fluent-bit/state/flb_myapp.db
This approach has multiple advantages. First, it filters at the filesystem level before Fluent Bit even opens files. More efficient than reading everything then filtering.
Second, it reduces memory usage. Fluent Bit only buffers logs from my-app pods. The 50MB memory buffer goes much further.
Third, it simplifies the configuration. No complex filter chains. No worrying about field names or nesting. Just a simple path pattern.
I applied this change, restarted Fluent Bit, and verified. Perfect. Only my-app logs appeared in Elasticsearch. The solution was elegant, efficient, and reliable.
Extending to Multiple Namespaces
A few weeks later, I needed to add logging for another project. The my-second-app namespace runs a separate captive portal application in the same Kubernetes cluster.
The beauty of the path filtering approach is how easily it scales. I added a second input section with a different tag and path pattern:
[INPUT]
    Name tail
    Path /var/log/containers/*_my-app_*.log
    Tag myapp
    DB /var/fluent-bit/state/flb_myapp.db

[INPUT]
    Name tail
    Path /var/log/containers/*_my-second-app_*.log
    Tag secondapp
    DB /var/fluent-bit/state/flb_secondapp.db
Then I routed each tag to a different Elasticsearch index using separate output sections:
[OUTPUT]
    Name es
    Match myapp
    Index app_logs
    Logstash_Prefix app_logs

[OUTPUT]
    Name es
    Match secondapp
    Index second_app_logs
    Logstash_Prefix second_app_logs
Now my-app logs go to app_logs-YYYYMMDD indices and my-second-app logs go to second_app_logs-YYYYMMDD indices. Both projects share the same Fluent Bit DaemonSet but maintain separate log streams.
This centralized approach is more efficient than running separate Fluent Bit deployments for each namespace. One DaemonSet handles multiple namespaces while keeping logs organized.
Production Deployment Best Practices
After running this setup in production for weeks, several best practices emerged.
First, always use separate database files for each input. The DB parameter tells Fluent Bit where to track its reading position. If multiple inputs share the same database, they interfere with each other.
Second, set appropriate memory buffer limits. I use 50MB per input, which handles typical Next.js application log volumes without issues. Monitor memory usage and adjust as needed.
Third, enable retry logic in the Elasticsearch output. Network hiccups happen. The Retry_Limit parameter ensures Fluent Bit keeps trying to deliver logs even when Elasticsearch temporarily goes down.
Fourth, use daily index rotation. The Logstash_Format and Logstash_DateFormat parameters create new indices daily. This makes old log deletion easier and keeps query performance fast.
Fifth, implement monitoring. Fluent Bit exposes metrics on port 2020. Integrate with Prometheus to track log collection rates, buffer usage, and Elasticsearch connection health.
Sixth, plan for index lifecycle management. Logs grow forever if you let them. Decide how long to keep logs and automate old index deletion. I keep 30 days of logs for debugging then delete older indices.
The Benefits: What Centralized Logging Enabled
Implementing centralized logging transformed how I debug production issues.
When users report problems, I search Elasticsearch for their session ID or IP address. All their requests appear across multiple pod restarts and deployments. I see the complete user journey.
Performance monitoring improved dramatically. I query Elasticsearch for slow API response times or high error rates. Patterns emerge that were invisible before.
Security auditing became possible. I track authentication failures, suspicious access patterns, and potential attacks. All preserved even when pods scale down.
Capacity planning uses real data now. I analyze log volumes by time of day and day of week. Traffic patterns guide infrastructure scaling decisions.
The integration with Mastering Automated Docker Tagging in GitLab CI/CD means I can correlate logs with specific deployments. When a new Docker image version causes issues, the logs tell me exactly what broke.
Common Issues and Troubleshooting
Several issues can trip you up when implementing Fluent Bit logging.
If logs do not appear in Elasticsearch, check three things. First, verify Fluent Bit pods are running. Second, check Fluent Bit logs for connection errors. Third, confirm Elasticsearch is accessible from inside the cluster.
If logs appear but lack Kubernetes metadata, check RBAC permissions. The ServiceAccount needs get, list, and watch permissions on pods and namespaces.
If memory usage grows uncontrollably, your buffer limits are probably too high. Or Elasticsearch cannot keep up with log volume. Check the Mem_Buf_Limit parameter and Elasticsearch ingestion rate.
If old logs from before the configuration change keep appearing, you are seeing historical data. Query Elasticsearch with a time range to see only recent logs. Old indices still contain pre filter logs.
If logs from unexpected namespaces appear, double check your input path pattern. Make sure the underscore positions match the Kubernetes log filename format exactly.
Key Takeaways for Kubernetes Logging
Centralized logging solves the ephemeral pod problem in Kubernetes. Your logs persist even when pods die. Debugging becomes possible. Historical analysis becomes reality.
Fluent Bit provides an efficient, lightweight solution for log collection. Input level filtering using file path patterns beats complex filter chains every time. The approach is simple, efficient, and scales to multiple namespaces easily.
RBAC permissions matter. Without proper permissions, Fluent Bit cannot enrich logs with Kubernetes metadata. The ServiceAccount, ClusterRole, and ClusterRoleBinding are not optional.
Plan for index lifecycle management from day one. Logs grow without limits. Decide retention policies early and automate old data deletion.
Start with one namespace. Get it working. Verify logs flow correctly. Then extend to additional namespaces. The incremental approach reduces complexity and makes troubleshooting easier.
Kubernetes logging does not have to be complicated. With the right approach, you get persistent, searchable logs that transform how you understand your production systems. The peace of mind knowing you will never lose critical debugging information again is worth every hour spent implementing it properly.