
Cloudflare waitUntil Logging: Audit Logs Without Latency
Log to D1 with ctx.waitUntil without slowing responses. Measured 306 ms vs 1.7 ms, plus why logs go missing and the Illegal invocation fix. See the code.
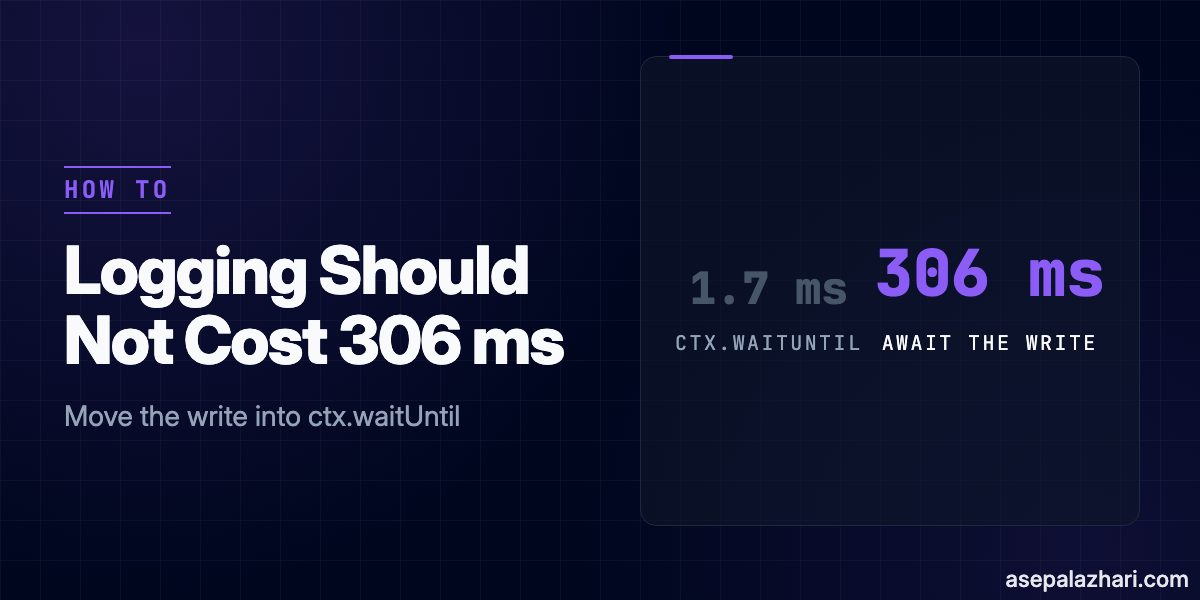
Awaiting a 300 ms database write inside a Cloudflare Worker makes every response take 300 ms. Moving the same write into ctx.waitUntil() dropped the response to about 1.7 ms in my local test, and the row still landed after the response was sent. That is the whole idea behind audit logging that never slows a request down.
Below is the audit wrapper I run in production in front of an upstream partner API, on Cloudflare Pages Functions with D1, Cloudflare’s SQLite-based database. You will also see how to store the exact request body that was sent, and the four reasons logs go missing inside waitUntil. You need a Workers or Pages project with a D1 binding. Every test here ran on Wrangler 4.124.0, the CLI I compare with the Cloudflare MCP server in Wrangler vs Cloudflare MCP Server for Agentic AI Coding.
The Pattern in Ten Lines
Do the work the visitor is waiting for, return the response, and hand the log write to the runtime as a promise it has to finish.
export default {
    async fetch(request: Request, env: Env, ctx: ExecutionContext): Promise<Response> {
        const response = await handle(request, env);

        ctx.waitUntil(
            env.DB.prepare("INSERT INTO audit_api_logs (endpoint, status) VALUES (?, ?)")
                .bind("submit-order", response.status)
                .run()
        );

        return response;
    },
};
ctx.waitUntil() is the Workers method that tells the runtime to keep a promise running after the response has been sent, so it does not delay the response. According to the Cloudflare Workers context docs, the runtime keeps the work alive for up to 30 seconds after the response is sent, and that budget is shared by every waitUntil call in the same request.
What It Costs: Await vs waitUntil
I simulated a 300 ms database write with setTimeout in a local Worker running on workerd through wrangler dev. Each route got five requests.
| Pattern | Average response time | What happened to the write |
|---|---|---|
| await the write before returning | 306 ms | Finished before the response |
ctx.waitUntil(write) | 1.7 ms | 3 of 3 finished after the response |
| Floating promise, no await, no waitUntil | 14 ms, one request | 0 of 3 finished |
This is a simulated delay, not a real D1 insert, so treat the shape as reliable and the exact numbers as local only. A real D1 write adds network and storage latency. Measure your own p50 and p95 before you quote a figure to anyone.
The Audit Wrapper I Run in Production
The wrapper takes a context object and a function that makes the upstream call. It times the call, reads only the sanitized status and message from a cloned response, prints one structured console line, and schedules the insert.
// functions/_shared/audit.ts
export interface AuditContext {
    db?: D1Database;
    waitUntil: (promise: Promise<unknown>) => void;
    endpoint: string;
    subject?: string | null;
    /** Filled in by the fetch helper with the exact JSON sent upstream. */
    requestPayload?: Record<string, string>;
}

export async function withAuditLog(audit: AuditContext, call: () => Promise<Response>): Promise<Response> {
    const startedAt = Date.now();
    const response = await call();
    const durationMs = Date.now() - startedAt;

    const result = (await response
        .clone()
        .json()
        .catch(() => null)) as { message?: string } | null;

    const entry = {
        endpoint: audit.endpoint,
        subject: audit.subject ?? null,
        success: response.status === 200 ? 1 : 0,
        status: response.status,
        message: result?.message ?? null,
        duration_ms: durationMs,
        request_payload: audit.requestPayload ? JSON.stringify(audit.requestPayload) : null,
    };

    const line = JSON.stringify({ event: "api_call", ...entry });
    if (entry.success) console.log(line);
    else console.error(line);

    if (audit.db) {
        audit.waitUntil(
            audit.db
                .prepare(
                    `INSERT INTO audit_api_logs
                        (endpoint, subject, success, status, message, duration_ms, request_payload)
                     VALUES (?, ?, ?, ?, ?, ?, ?)`
                )
                .bind(
                    entry.endpoint,
                    entry.subject,
                    entry.success,
                    entry.status,
                    entry.message,
                    entry.duration_ms,
                    entry.request_payload
                )
                .run()
                .catch((error) => console.error(JSON.stringify({ event: "audit_log_failed", error: String(error) })))
        );
    }
    return response;
}
Three choices matter here. response.clone() leaves the original body untouched for the caller. Only the sanitized message is read, so API keys and passwords cannot leak into a log. The .catch sits inside the waitUntil promise, so a failing insert prints audit_log_failed and never touches what the visitor gets.
The table is plain SQLite, since D1 is SQLite underneath.
-- migrations/0011_audit_api_logs.sql
CREATE TABLE IF NOT EXISTS audit_api_logs (
    id INTEGER PRIMARY KEY AUTOINCREMENT,
    endpoint TEXT NOT NULL,
    subject TEXT,
    success INTEGER NOT NULL,
    status INTEGER NOT NULL,
    message TEXT,
    duration_ms INTEGER,
    created_at TEXT NOT NULL DEFAULT (strftime('%Y-%m-%dT%H:%M:%fZ', 'now'))
);

CREATE INDEX IF NOT EXISTS idx_audit_api_logs_created ON audit_api_logs (created_at DESC);
I wanted rows I could query a week later, not a live tail that is gone once I close the terminal.
Also Read: Handling 429 Rate Limits in Bulk API Requests
Store the Exact Payload, Not a Rebuilt One
The first version of this table recorded the endpoint, the subject, the status, the upstream message, and the duration. That told me an upstream call failed. It could not tell me what I had actually sent. Two migrations later the table has a request_payload column.
-- migrations/0012_audit_api_logs_payload.sql
-- Exact JSON body sent upstream. NULL for rows written before this migration
-- and for calls that failed before a request was built. The API key travels
-- in a header and is never part of this payload.
ALTER TABLE audit_api_logs ADD COLUMN request_payload TEXT;
D1 has no jsonb type, so the payload is stored as TEXT. The capture happens in the helper that calls fetch, right before the request goes out, by writing to the same context object the wrapper reads afterwards.
async function postUpstream(
    url: string,
    apiKey: string,
    payload: Record<string, string>,
    audit?: AuditContext
): Promise<Response> {
    if (audit) audit.requestPayload = payload;

    let upstream: Response;
    try {
        upstream = await fetch(url, {
            method: "POST",
            headers: { "Content-Type": "application/json", "X-API-KEY": apiKey },
            body: JSON.stringify(payload),
        });
    } catch {
        return Response.json({ code: 502, message: "Upstream unreachable." }, { status: 502 });
    }

    const result = (await upstream.json().catch(() => null)) as { code?: number; message?: string } | null;
    if (!upstream.ok || result?.code !== 200) {
        return Response.json(
            { code: upstream.status || 502, message: result?.message ?? "Request failed." },
            { status: upstream.ok ? 403 : upstream.status || 502 }
        );
    }
    return Response.json({ code: 200, message: result.message }, { status: 200 });
}
Why not rebuild the payload inside the wrapper? Because the code that builds a payload changes. I changed the upstream version, the timeout value, and which fields I sent several times in one week. A rebuilt copy drifts from the real body, and then the log lies to you at the exact moment you trust it.
Wiring it into a Pages Function takes four lines.
export async function onRequestPost({
    request,
    env,
    waitUntil,
}: {
    request: Request;
    env: Env;
    waitUntil: (promise: Promise<unknown>) => void;
}): Promise<Response> {
    const body = await request.json();
    const audit: AuditContext = { db: env.DB, waitUntil, endpoint: "submit-order", subject: body.accountId };
    return withAuditLog(audit, () => postUpstream(env.UPSTREAM_URL, env.UPSTREAM_KEY, body.payload, audit));
}
Notice that postUpstream turns a network failure into a 502 Response instead of throwing. That is why failed calls still reach the logger. If your upstream helper can throw, wrap the await call() in the wrapper with try and finally, or those failures will leave no row at all.
Why Do Logs Go Missing in waitUntil?
I reproduced each of these locally, so the output below is real.
A Floating Promise Is Dropped
Start a write without await and without waitUntil, return the response, and the write never finishes. I sent three requests to each route and read a counter two seconds later.
{ "arrow": 3, "direct": 3 }The route with a bare floating promise does not appear at all, which means 0 of 3 writes completed. The Workers best practices describe the same thing. A floating promise risks being cut off, and its errors are swallowed.
Copying waitUntil Off ctx Throws Illegal invocation
In a Worker, waitUntil needs its this to be the execution context. Destructure it or copy it onto another object and you get this on the first call.
TypeError: Illegal invocation: function called with incorrect `this` reference.My audit context is exactly that kind of object, so in a Worker this version fails.
const audit = { waitUntil: ctx.waitUntil }; // Illegal invocation on first useThis one works, because the arrow function calls the method on ctx itself.
const audit = { waitUntil: (promise: Promise<unknown>) => ctx.waitUntil(promise) };In my test the arrow version completed 3 of 3 writes, the same as calling ctx.waitUntil() directly. Cloudflare lists this under Illegal invocation errors.
The 30 Second Budget Is Shared
Every waitUntil promise in one request shares the same 30 seconds after the response. Several slow log writes plus a slow analytics call can starve each other. One rejected promise does not cancel the others, so an error in one write will not stop the next one, but you will not see it unless you catch it yourself.
Swallowed Failures and Early Exits
The wrapper only reaches waitUntil after await call() returns. If the call throws, nothing is scheduled. And without the inner .catch, you get no structured line telling you which insert failed. Both are easy to miss because the visitor sees a perfectly normal response.
Does waitUntil Work the Same in Pages Functions and Workers?
The same idea behaves differently depending on where the handler lives.
| Runtime | Where waitUntil lives | Safe to destructure? |
|---|---|---|
| Workers | ctx in fetch(request, env, ctx) | No, Illegal invocation |
| Pages Functions | The context argument of onRequestPost | Yes, tested on Wrangler 4.124.0 |
Pages is the exception because the Pages worker template in Wrangler binds the function for you. Line 157 of pages-template-worker.ts in Wrangler 4.124.0 reads waitUntil: workerContext.waitUntil.bind(workerContext). My own wrangler pages dev run confirmed it: a handler with { waitUntil } in its signature answered in 15 ms and its log line printed 301 ms later.
That matters if you migrate. Pages is not going away. A 2026 comparison of the two notes that Pages remains fully supported while Cloudflare steers new full-stack projects toward Workers, and Cloudflare publishes a guide for migrating from Pages to Workers. If you do move, a handler that destructured waitUntil happily on Pages will throw Illegal invocation the day it becomes a Workers fetch handler. If your site is Astro on Cloudflare, I covered the Workers-first direction in Astro 6 After Cloudflare: Why I Upgraded Now.
Also Read: Next.js output export: generateStaticParams Error Fix
When Is waitUntil Not Enough?
waitUntil is best effort, not a durable guarantee. If the isolate is cut off before the write finishes, that row is gone, and nothing retries it.
For diagnostic logs that is a fair trade. A missing row in a debugging table costs you a bit of context. For billing records, security events, or anything an auditor might ask for, a missing row is a real problem. Await the insert before you respond, or send a message to Cloudflare Queues from the request and write the row in the consumer.
My rule is simple. If losing one entry would make you apologize to someone, do not put it in waitUntil. If it would only make debugging slower, use the wrapper above and keep every response fast.